01
Power BI consulting and development
Semantic models, DAX measures, Power Query, reports, row-level security and deployment pipelines, built by Power BI developers who also write software.
FIG 01 · Data Visualization
Power BI reports, Tableau dashboards and custom React dashboards inside your product, connected to your CRM, ERP, store and spreadsheets, with licences sized to your budget.
See how it works
FIG 02 · Quick answer
Data visualization services turn data from your CRM, ERP, store and spreadsheets into dashboards people can act on. Elgrith connects the sources, builds a clean data model, designs Power BI or Tableau reports, or codes custom dashboards into your product, then sets refresh schedules, row-level security and licences that fit your budget.
FIG 03 · Why it matters
From Microsoft’s Power BI pricing page (read 22 Oct 2026) and Microsoft Learn’s Fabric licensing guide. These are Microsoft’s prices, not ours.
01
$14
Microsoft lists Power BI Pro at $14.00 user/month, paid yearly, and Premium Per User at $24.00 (US list prices).
Source: Microsoft, Power BI pricing (US), read 22 Oct 2026(opens in a new tab)02
F64
Microsoft says that on F64 or larger capacity, users with only a Free licence and a viewer role can view Power BI content.
Source: Microsoft Learn, Microsoft Fabric licenses(opens in a new tab)03
250
Microsoft says Premium Per User is more cost effective when Premium features are needed for fewer than 250 users.
Source: Microsoft Learn, Microsoft Fabric licenses(opens in a new tab)FIG 04 · Decide
Data visualization is the design and engineering of charts, dashboards and reports that help people understand data and act on it. Most teams pick one of three routes. Here is how we help you decide.
| Power BI | Tableau | Custom dashboard (React, D3) | |
|---|---|---|---|
| Best for | Teams on Microsoft 365, Excel and Azure | Teams already invested in Tableau | Dashboards inside your SaaS product, portal or app |
| Who builds reports | Analysts and power users, with our models | Analysts, with our data sources | Our developers, to your design |
| Licensing | Per user (Pro, PPU) or Fabric capacity | Per user, by role | No BI licence; you pay for hosting |
| Watch for | Licence costs as viewers grow | Licence costs and server upkeep | Every new chart needs a developer |
We often combine them: Power BI for internal reporting, a custom dashboard for the customers who log into your product.
Read Power BI vs Tableau (2026)FIG 05 · What you get
From the data model to the last chart: Power BI, Tableau and custom dashboards, designed so people use them and engineered so the numbers are right.

01
02
03
04
05
06
Deliverables
12
FIG 06 · Dashboards
Every dashboard starts with the decisions it should support, not the data you happen to have.
FIG 07 · Flagship build
Kenerate AI is our flagship build, an AI image and video studio we designed and engineered, with hundreds of models, studios and a credit system behind one interface. It is not a BI tool; it shows the engineering behind our custom dashboards.
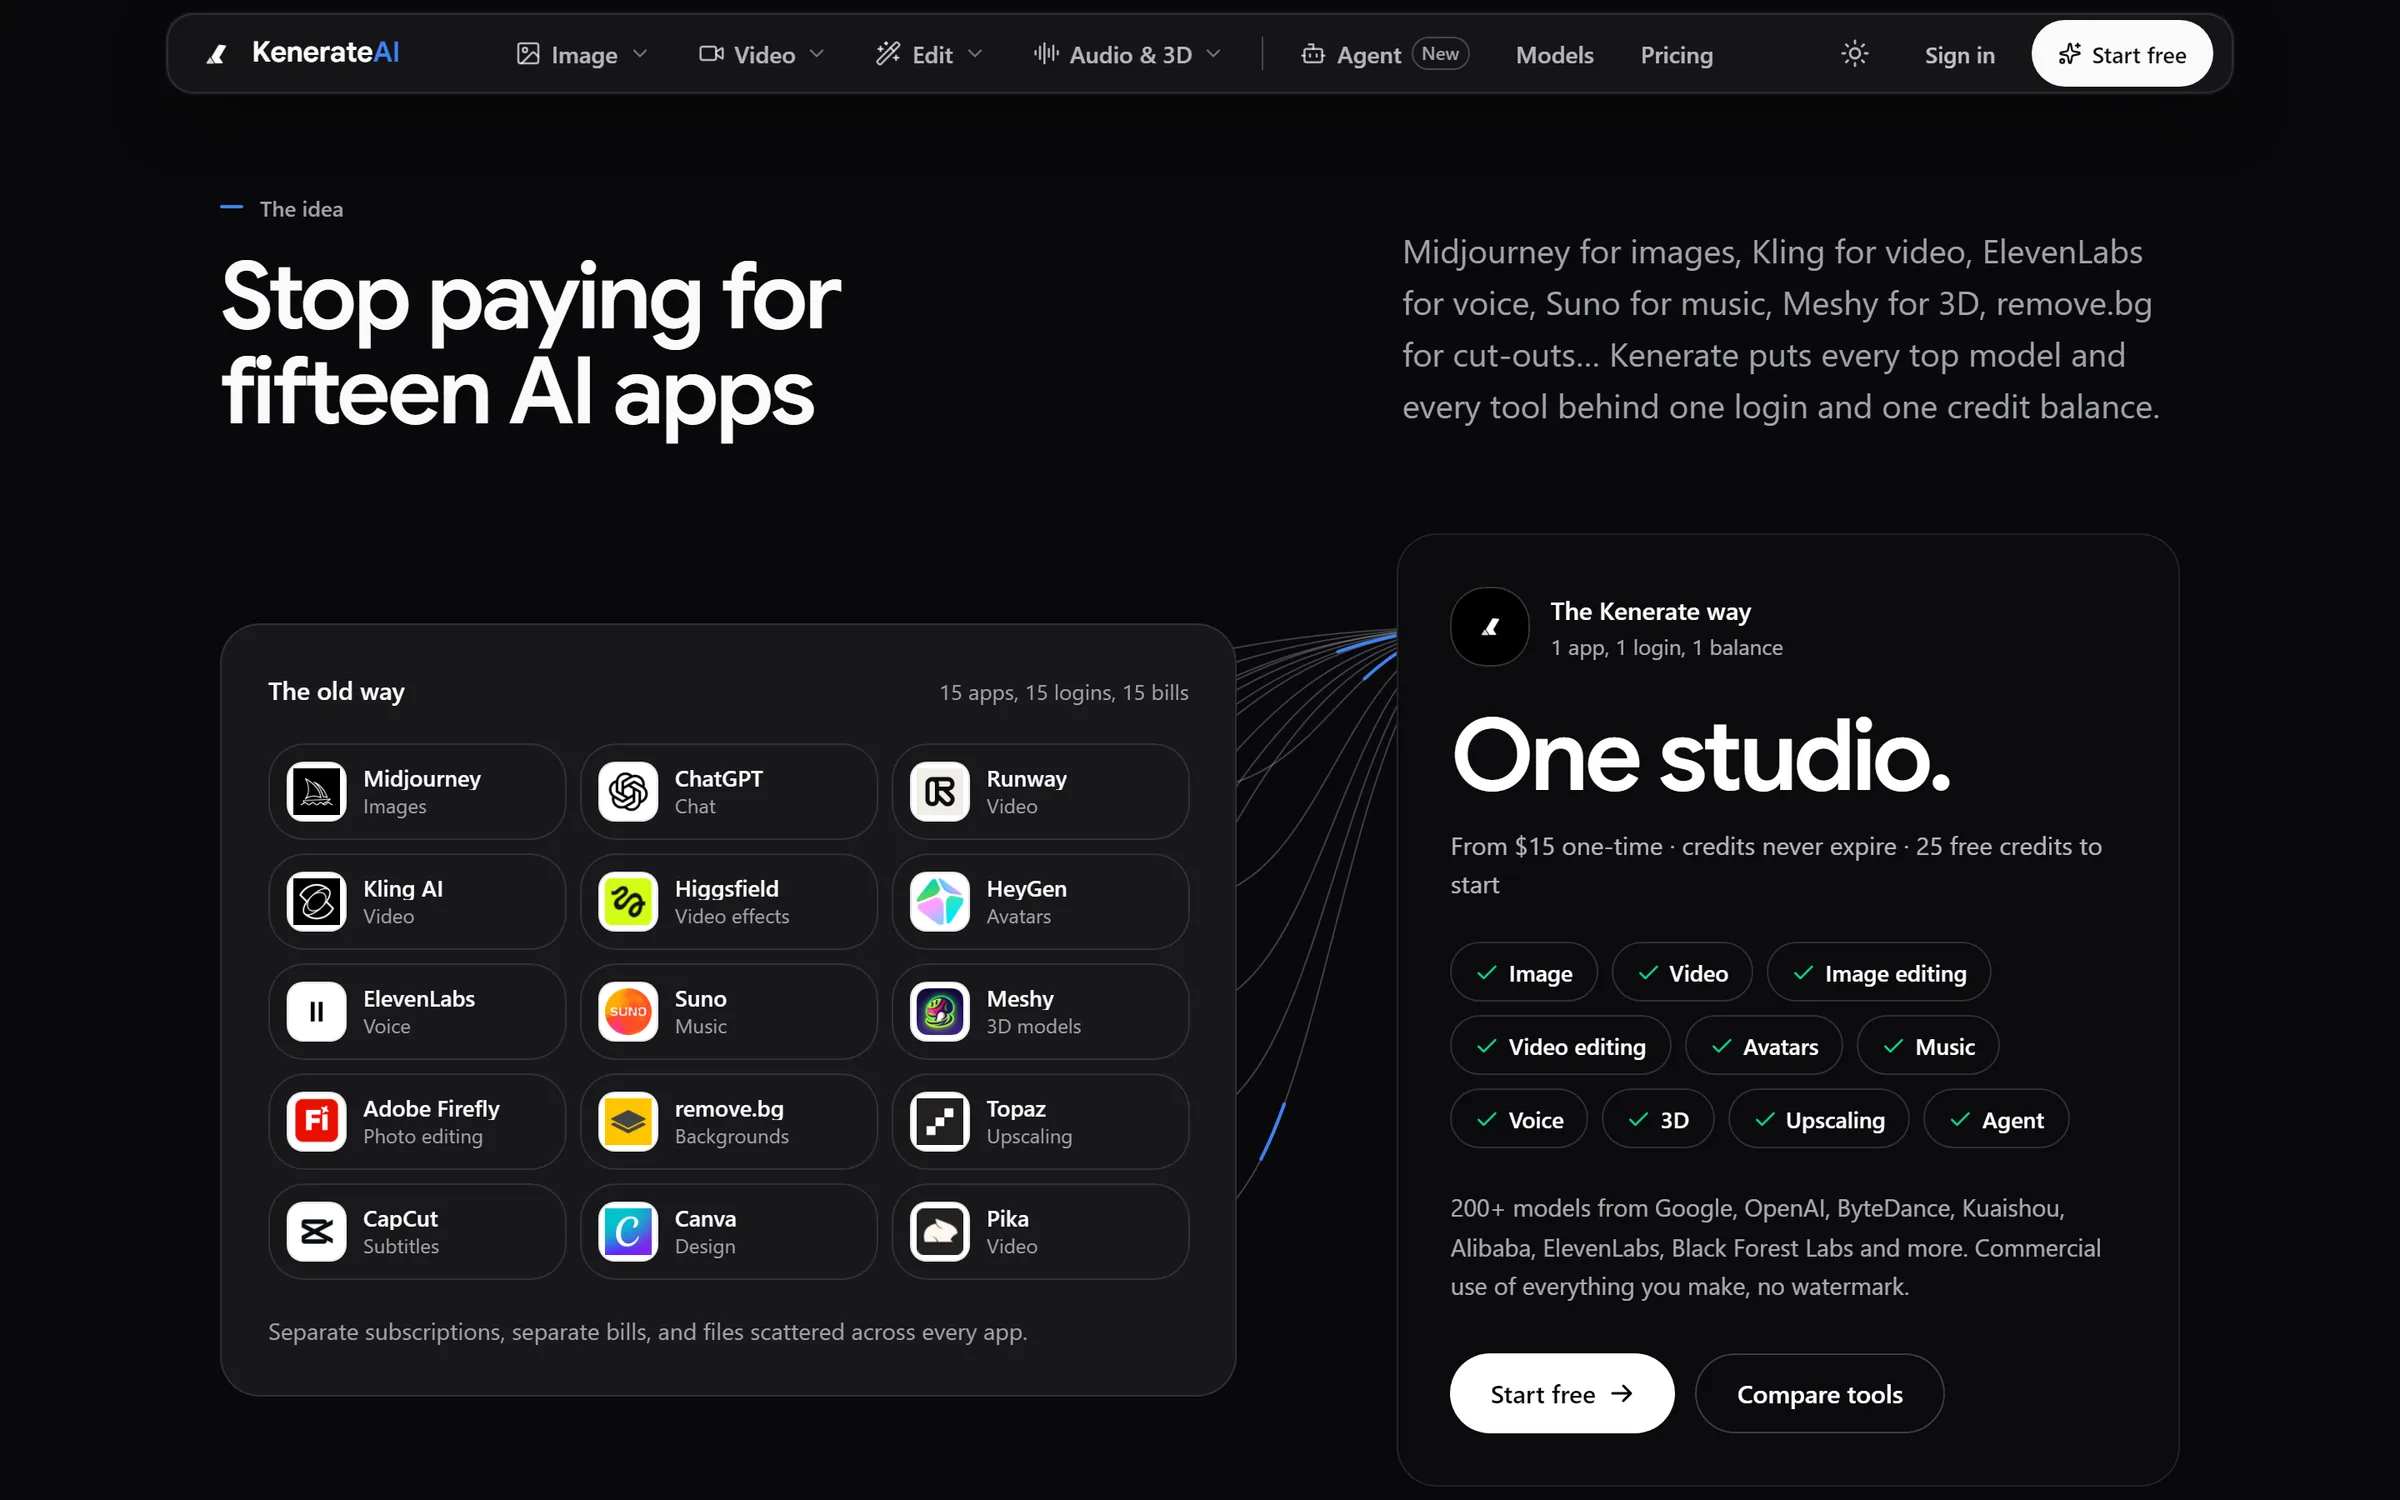
The idea: 15 apps, 15 logins, 15 bills become one studioDesigned and engineered by Elgrith
FIG 08 · Licensing
Licences often cost more over time than the build, so we plan them first. Microsoft is also “retiring the Power BI Premium per-capacity SKUs” in favour of Microsoft Fabric capacity, so older advice may be out of date.
06principles
Per-user licence for building and sharing reports. Microsoft lists it at $14.00 user/month, paid yearly (US), or £10.80 ex VAT (UK).
Premium features for each user: $24.00 user/month, paid yearly (US), or £18.50 ex VAT (UK). Microsoft says it is more cost effective for fewer than 250 users.
Capacity for an organisation rather than per user. On F64 or larger, viewers with only a Free licence can view Power BI content.
Microsoft is retiring these SKUs, so we plan moves to Fabric capacity for teams still on them.
We count builders and viewers, then compare Pro, PPU and Fabric for your numbers before anything is bought.
Power BI and Tableau pricing and features side by side, with sources.
Read the comparisonFIG 09 · Design
A dashboard nobody trusts or understands is an expensive screenshot. We design for adoption from the first workshop.
04principles
We agree the questions and the decisions first, then choose the few measures that answer them.
Headline numbers first, trends next, detail on demand, so the first screen answers the first question.
Palettes that work for colour-blind readers, with labels and patterns so colour is never the only signal.
FIG 10 · Measurement
Every dashboard is tested against the source systems before your team sees it.
| Check | Why it matters | How we check it |
|---|---|---|
| Numbers reconcile | One wrong total destroys trust | Totals checked against the source systems |
| Refresh works | Stale data leads to wrong decisions | Scheduled refresh tested and alerting on failure |
| Row-level security | People must see only their data | Tested with real user roles |
| Performance | Slow reports don’t get used | Load and filter times checked on real data volumes |
| Accessibility | Everyone should be able to read it | Contrast, labels and keyboard checks |
| Adoption | The point is use | Usage reports reviewed after launch, if agreed in scope |
FIG 11 · Process · 6 steps
A free call, a fixed written quote, weekly demos while we build, then training and support. You own the models, reports and code.
Workshops with the people who will use the dashboard: the decisions they make and the numbers they need.
Sources connected and a clean data model built, with measures defined once and documented.
A clickable prototype of the key pages, reviewed with your users before the full build.
Reports or custom dashboards built with weekly demos, row-level security and refresh schedules.
Training for viewers and builders, plus written guides, so your team can read and extend the reports.
Fixes, new reports and licence reviews as your needs grow, if agreed in scope.
FIG 12 · What you get
Written into your fixed quote, so you know exactly what you are paying for before work starts.
12items
FIG 13 · Tech & tools
Proven, well-supported tools, chosen for your project and set up in accounts your business owns.
FIG 14 · Who it’s for
The right route depends on who builds and who views.
3 audiences
Microsoft 365 teams
Power BI consulting services for teams on Excel, SharePoint, Dynamics or Azure, with licences planned for builders and viewers.
SaaS products
Custom dashboards your customers see when they log in, built in React and served from your own database, with no per-viewer BI licence.
UK teams
UK projects run through our London client partner, with Power BI consultants working from our New Delhi HQ. Microsoft UK lists its prices ex VAT.
FIG 15 · Working with us from the USA and UK
Every project gets a point of contact in New York or London and an engineering team in New Delhi. Here is how today’s working days line up, live.
New York
North America
--:--ET
London
UK & Europe
--:--UK
Fixed-scope project
A written scope, one fixed price and a dated plan. Suits websites, apps and MVPs.
Dedicated team
Designers and engineers on your roadmap every month, billed monthly.
White label
For US and UK agencies: our work, your brand, unbranded deliverables.
Calls on ET or UK hours
FIG 16 · Licences
Microsoft’s list prices, read on 22 Oct 2026 from its US and UK pricing pages. UK prices exclude VAT. These are paid to Microsoft, not to Elgrith.
| Licence | US list price | UK list price | Good fit |
|---|---|---|---|
| Power BI Pro | $14.00 user/month, paid yearly | £10.80 user/month, ex VAT | Teams where most people build and share reports |
| Premium Per User | $24.00 user/month, paid yearly | £18.50 user/month, ex VAT | Premium features for fewer than 250 users |
| Fabric capacity (F64 or larger) | Capacity pricing; see Microsoft | Capacity pricing; see Microsoft | Many viewers on Free licences |
Prices change. We confirm current prices on Microsoft’s pages before any licence plan is signed off.
FIG 17 · Compare
| Data visualization consulting | Do it yourself | |
|---|---|---|
| Data model | Designed once, documented, reused | Often rebuilt in every report |
| Accuracy | Reconciled with the source systems | Depends on who built it |
| Licences | Planned for your users | Often bought before needs are clear |
| Security | Row-level security tested | Often shared too widely |
| Best for | Dashboards the business relies on | Personal analysis and quick checks |
FAQ
Straight answers about Data Visualization with Elgrith.
It depends on the number and quality of your data sources, the complexity of the data model, how many reports you need and your licensing. After a free call you get a written scope and a fixed quote. Microsoft’s licence costs are separate and paid directly to Microsoft.
FIG 18 · Related
Free 30-minute call
Tell us what you report on today. After a free call you get a KPI plan, a licence plan, a written scope and a fixed quote.
Pick a day. You'll choose a time in your own time zone on the next step.